
Dashboards — creation, filters and sharing
Purpose
Select relevant numbers and check source/period before sharing.
Step by step
- 1
Open Dashboard and use New Dashboard; enter Name and Description and confirm Create Dashboard.
- 2
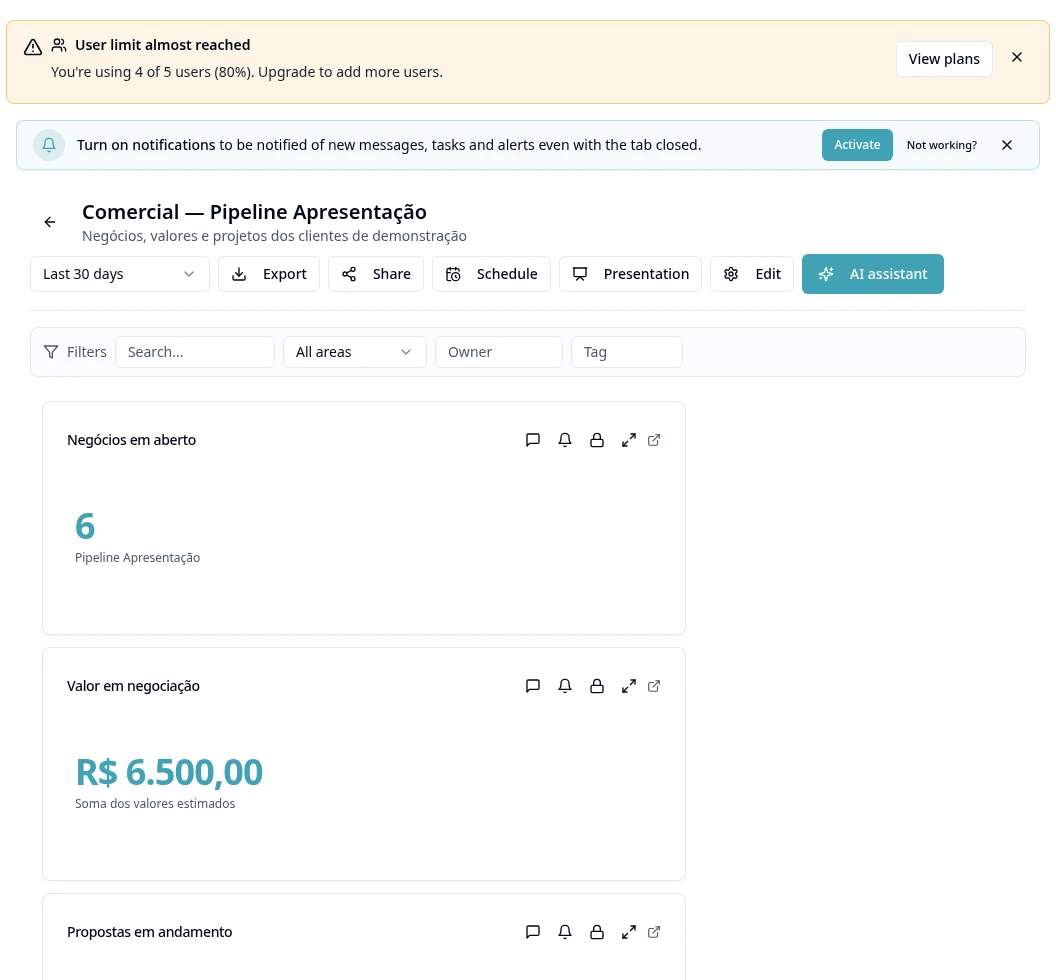
Open the dashboard and prepare widgets with the available options; if you use the AI Assistant, review the suggested source, filters and result.
- 3
Use the editing actions to arrange and resize the grid.
- 4
Select period and global filters when authorized and use the same slice when comparing numbers.
- 5
In Share, choose Users and View/Edit permission, or Public link when available.
- 6
A public link exposes the dashboard: make sure the content can be disclosed and set an expiration with the on-screen options.
- 7
Use export, presentation or scheduling according to your permission.
- 8
Check source data and coverage; an empty dashboard may depend on filters, records or access, not on a missing universal indicator.
Available controls depend on your user permissions and organization settings. If an option is missing, ask the administrator to check your module access.